


Spotify Project: Today’s Top Hits Top 100 Data
The Idea
Visualize the top 10 of Spotify’s Today’s Top Hits playlist throughout 2015.
In wanting to learn data visualization, it’s best for me to learn by projects. This process will help me understand data collection, sanitation, and visualization on a small scale. Plus, I love music and listen to this playlist often.
Manual Data Collection… yuk
In time, I’ll find out if there is an automated way of getting this information. For the moment, I’ll manually grab the information from the playlist every Monday.
I chose Mondays because Tuesday is the day for new music. It will allow 6 days for the new music to work through the list.
I quickly learned that the Today’s Top Hits list is more of a curated list, so I switched to grabbing data from the Top 100 Playlist which appears to be by data. I was lucky that I had done some sampling before the start of the year or I would have missed out on a week of info.
Attributes
- Date
- Position
- Title
- Artist
- ID
- Image URL
Grabbing Data
I started by grabbing the information that Spotify makes easily available: HTTP Link, Spotify URI, and Embed Code. Here is an example of the information for the first song:
- HTTP Link = http://open.spotify.com/track/4bBrKDo8rchikwZOtmXbIH
- Spotify URI = spotify:track:4bBrKDo8rchikwZOtmXbIH
- Embed Code =
It seems that the ID is used for all of the attributes. There’s a lot of redundancy if I’m collecting 10 songs per week and it can all be generated if necessary automatically. All I need from that is the ID: 4bBrKDo8rchikwZOtmXbIH
Visualization Plans
I know that I’ll be using D3 because this won’t be a simple graph. Over time, I’m guessing that there will be some interesting info to be shown and that it will require customization.
While I have minimal data, the first decision is whether to display the dates horizontally or vertically. On a small screen, vertically makes the most sense. On a large screen, horizontal will allow for linear scrolling. Showing the path of a track through the weeks will always be tough on a small screen so that’ll be something to learn along the way.
Setup
Fortunately, this will be very simple. There’s no need for a build system. An HTML file, the data file, and D3 should suffice for now. If there ends up being a way to grab this data from an API I would need to set up an app, but I’ll deal with that later if necessary.
Everything will be in the repo:
Design Decisions
In playing with the sample data, there are already some decisions to make. While listing the #1 first feels right for the data, my eyes tend to follow the list to the right. If it stays horizontal, I think the #1 should be last.
- Should dates run vertically or horizontally?
- What data should be shown in the up state vs. a hover state?
- What other data should be shown?
- Where should additional data be shown?
January 18
Some changes are already in play. In playing with the arrangement and figuring out what data should be shown, it became clear to me that the individual song data is more interesting than the week-to-week.
This means that I need to structure the data in a way that allows for tracking an individual song’s stats as well as each week’s. I’m picturing that each week will be 10 vertical rows with each song showing it’s meta data and a graph of it’s performance through the list. I’ll need a way of designating the entry point of the song because that will be interesting info to show as well.
I was using Numbers to track this, exporting to CSV, using a CSV to JSON automater, and then working with the JSON. Now that I’m using Middleman, I think I’m going to use YML for a bit because of the clean structuring. If I ever tried grabbing all of the info from Spotify’s API, I’d likely need to use JSON but I’m not sure I can pull off the structuring I need.
For example, this week I’m going to try using their API to make the data collection faster. They don’t link to the image URL so that part will still be manual. You can grab playlist info.
I’m slightly scared of the maintenance of the solution for tracking the progress of the track. It’s simple but requires backwards updates. You’re probably just not supposed to do things like this without a database. We shall see…
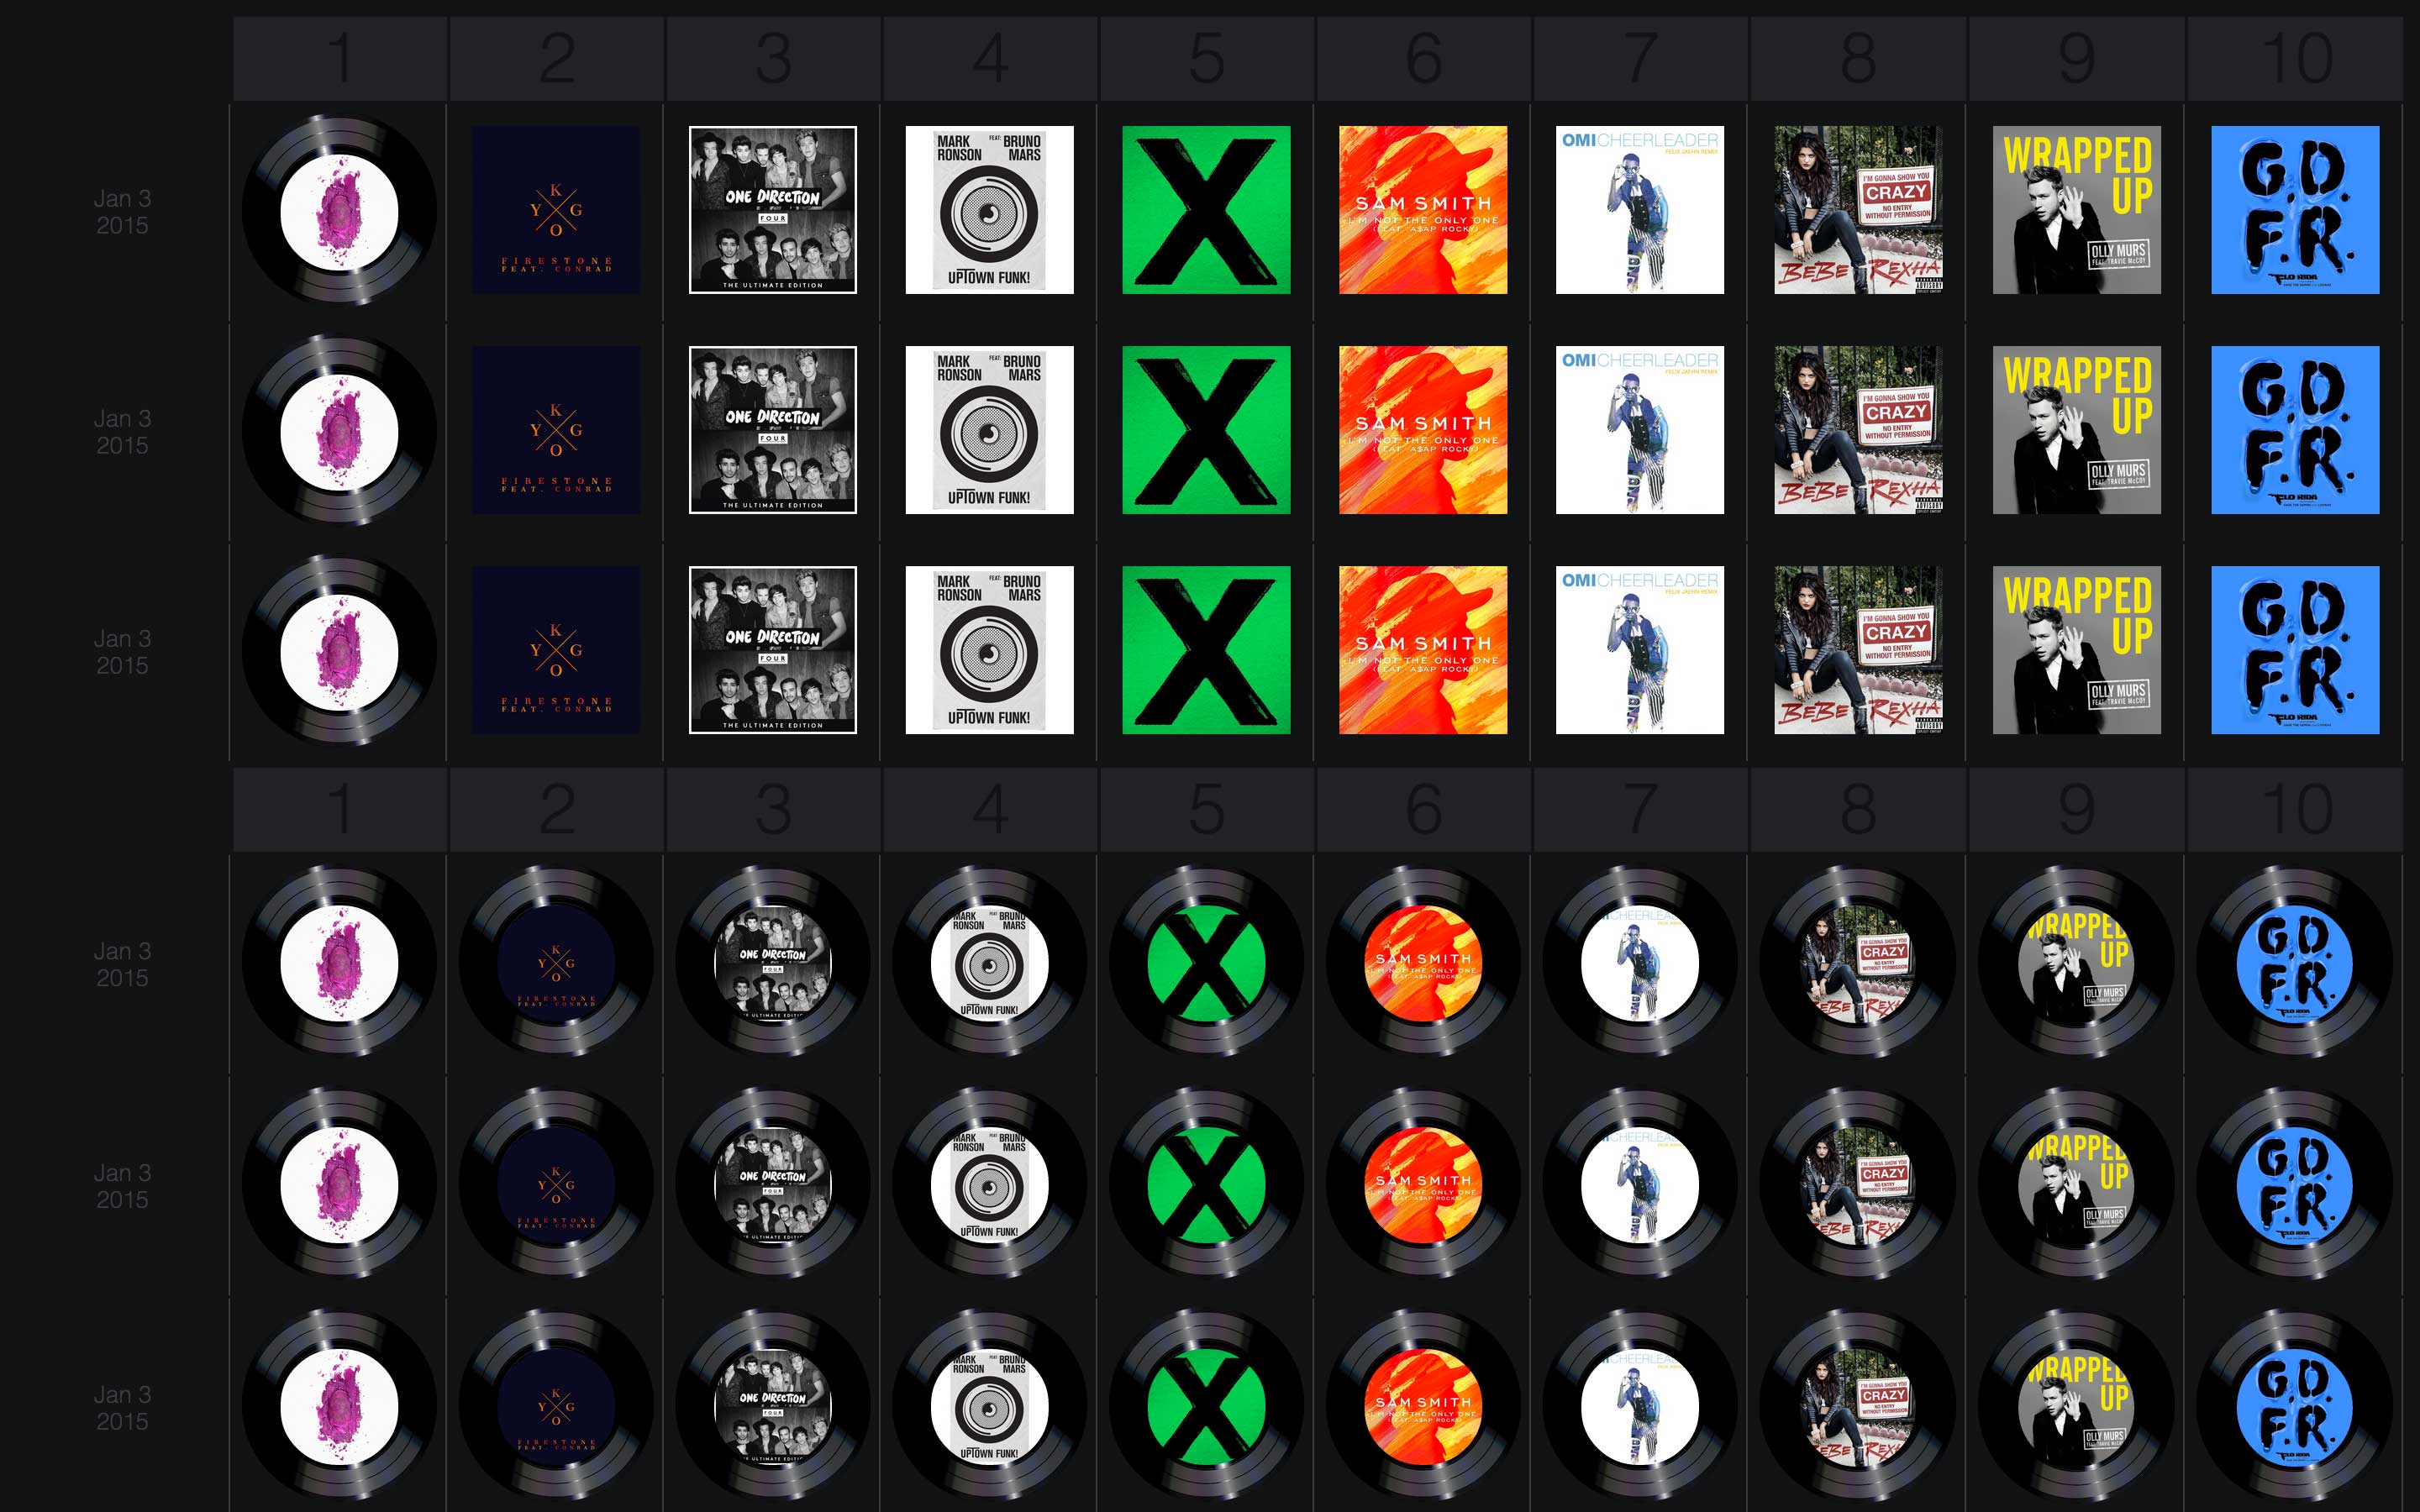
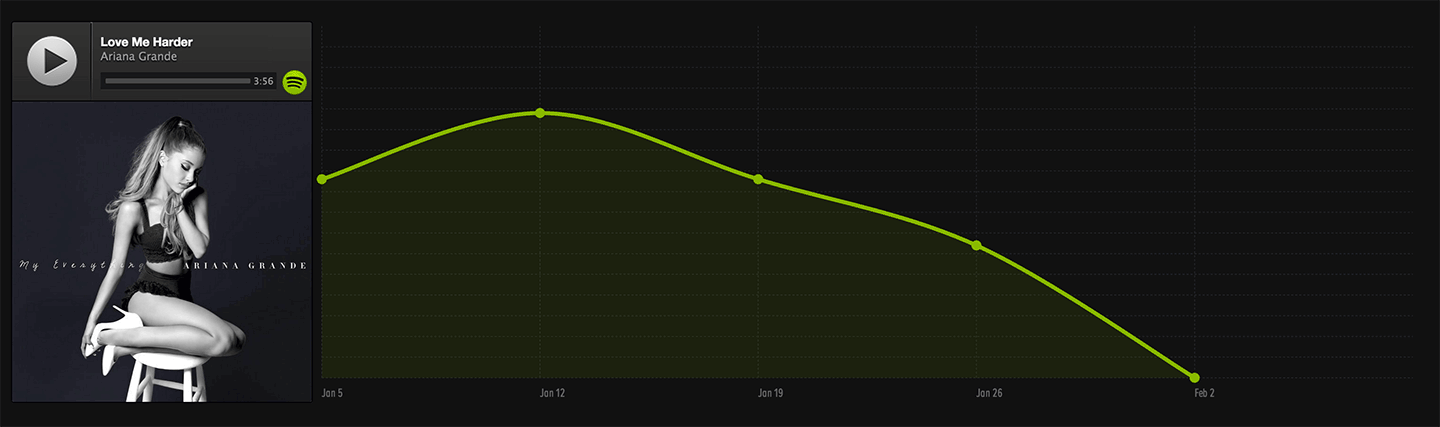
Final note for the day: I’m pretty sure that I want the embed available as an option. What’s the fun of seeing a song if you can’t play it, right? The embeds actually display all of the meta information that I am showing as well. They’re so big, but I’m wondering what it’d look like with a bunch of them. So I’m going to replace the images for the moment and compare a couple things.
Final note for the day: I’m pretty sure that I want the embed available as an option. What’s the fun of seeing a song if you can’t play it, right? The embeds actually display all of the meta information that I am showing as well. They’re so big, but I’m wondering what it’d look like with a bunch of them. So I’m going to replace the images for the moment and compare a couple things.
A page with images has 49 requests and weighs in at 1.1mb A page with embeds has 428 requests and weighs in at 4.4mb
It’d be irresponsible to do that for every set, so I’ll have to work in the embeds in a different way.
January 19
Grabbing data from the Spotify API is pretty straight forward but it’s a lot of data. I can trim it down but I still have to comb through a lot. The nice thing is that I think it would be possible to grab all of the meta that I want from it if I wanted to. It’s set to grab the current state of a playlist, though, so this would have to be set to an automated job or I would have to do it weekly. It may be worthwhile to set that up just in case.
Already borked the data once. I put the concurrent weeks in the wrong order. Sooooo thankful for that numbers sheet. Added just the slightest bit of styles just so it didn’t look like an explosion.
Made a mess of things tonight. I need to learn Bower. I was able to install Chartist from it, but I’m not sure how to reference it from Middleman so I ended up just duping it in the repo. Also, writing the Chartist JS in Coffee is odd. It requires weird structuring. The saddest part is that I’m likely not going to be able to use it. I love the simplicity of it, the weight, and the styles. However, I think I need the customization of d3. I want the scales to increase by 1 so you can see 10 places and I need to invert the scale so that 6 is higher than 8, for example.
January 20
I guess it needs to be design time. I have the information I need in a structure that seems to work. There are patterns emerging in the data that give me an idea of what I want to show. I can’t use Chartist for it, so now I need to figure out how I want it to look so that I know what to learn in d3.
I’ve been stashing a bunch of interesting data viz work for inspiration and there was a piece that caught my eye today. There are so many good ideas in that set and a few patterns that make sense for this project.
January 21
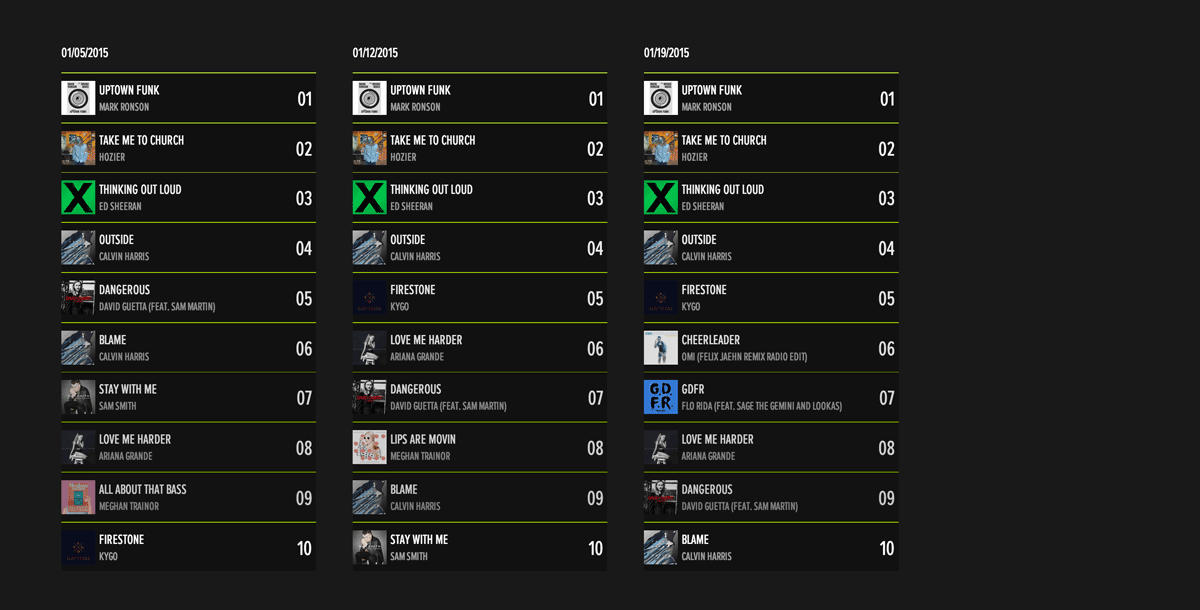
Archiving screenshots of things that I’m killing. User tested the layouts and everyone (Cherrie and Jasmine) prefer the grid of album covers. So, I’m rolling with that. Also killing the chartist stuff since I can’t use it.
January 22
Drew had exactly what I needed the whole time as I fought to make the classes from the song titles last night. middleman library
January 27
Negative numbers! It hit me today while driving that negative numbers would help with plotting and showing change from week to week. I still can’t use Chartist because of the lack of control over the guides, but making 10 and 1 be -10 and -1 would allow for the graph to work properly.
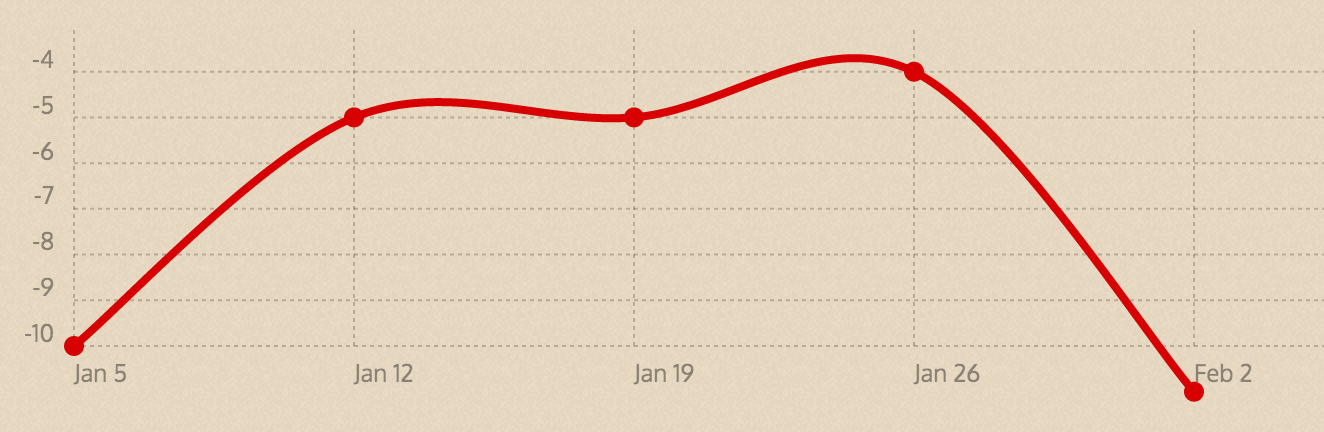
Showing the change from week to week would work too: 4 - 2 = 2, but it’s really a drop of 2 spots. If -4 and -2 are used, -4 - -2 = -2. We’ll see what I can do with that.
Feb 2
I played with a staggered view a bit and I’ll keep it for now. So far it’s the best representaiton of the positions but I’m not sold on it.
Some interesting data is starting to form. There are definitely things that I want to be able to show: highest jump in the charts, best starting point, and total number of individual tracks are a few. Those will definitely take some learning and I hope it can be done with the data as is.